Visualization of GTEx Data
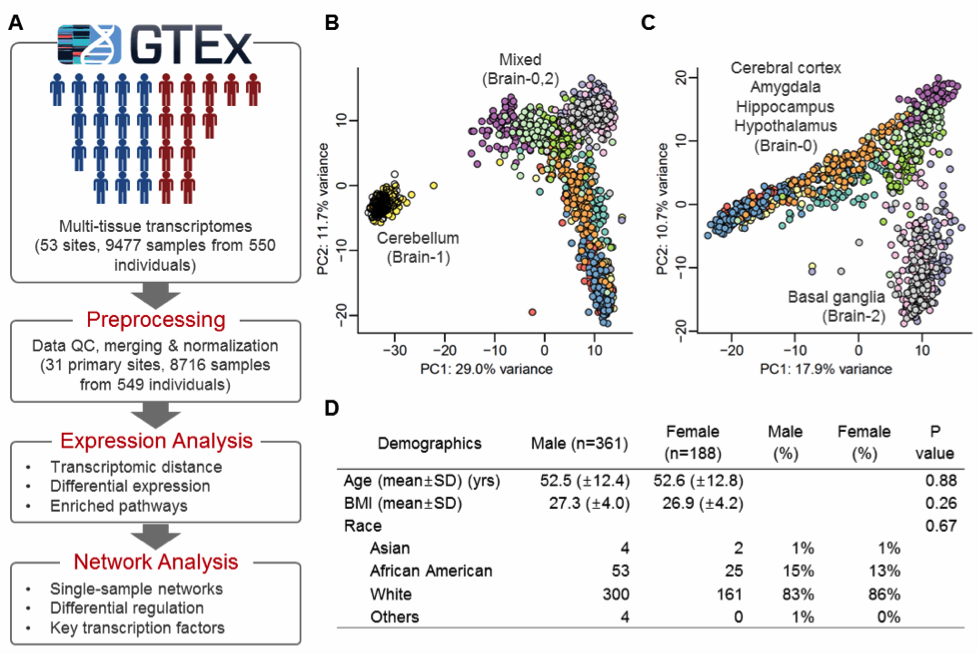 Overview of this study. (A) The study workflow. The GTEx v6 data set was used and annotated based on GENCODE v19, GRCh37.p13 (Dec 2013). (B-C) Anatomically close brain subregions cluster together based on the results of principal component analysis of gene expression for (B) all brain samples and for (C) all brain samples excluding cerebellum (Brain-1). (D) Demographics of the 549 study subjects. The “Others” class includes 2 American Indian or Alaska Native and 2 unknown. P-values were calculated using t-test (for age and BMI) or Chi-square test (for race).
Visualization code available here.
A network-based approach to eQTL interpretation and SNP functional characterization
Expression quantitative trait loci (eQTLs) analysis is commonly used to identify genetic variants affecting gene regulation. While such studies provide insight into genetic associations, they generally consider only cis-acting SNPs, and fail to address tissue-specific effects that might influence eQTL associations. Here we applied a meta-analysis approach that jointly analyzes cis- and trans-eQTLs. Using data from twelve tissue types from the Genotype-Tissue Expression (GTEx) project V6, we identified hundreds of thousands significant eQTLs in each tissue (FDR < 10%), among which 12% to 42% were trans-eQTLs. By representing the associations between SNPs and genes as links in a bipartite graph, we discovered that these eQTL networks organize into dense, highly modular communities, driven by biological processes. While some communities are enriched for processes relevant to the tissue of origin, other communities can be retrieved in several tissues and are enriched for general functions. We found that SNPs with high degree of centrality, representing global hubs in the networks, were completely depleted in GWAS association with traits and diseases. Contrary to the global network hubs, we found that local, community-specific network hubs are enriched for association with traits and diseases. These “core-SNPs” are also preferentially located in active chromatin regions, such as DNase hypersensitive regions with active transcription factor binding sites, further implicating a regulatory role. Our results lead to new hypotheses about how large numbers of weak- effect SNPs may work together to alter function and phenotype.
Please cite:
Maud Fagny, Joseph N. Paulson, Marieke L. Kuijjer, Abhijeet R. Sonawane, Cho-Yi Chen, Camila M. Lopes-Ramos, Kimberly Glass, John Quackenbush, and John Platig (2017). Exploring regulation in tissues with eQTL networks. PNAS published ahead of print August 29, 2017, doi:10.1073/pnas.1707375114
QTL Associations for given Gene or SNP in community:
GO terms for the community
Genes in the community
SNPS in the community
eQTL Community Analysis Legend
QTL Associations
- RSID - SNP ID in dbSNP 142
- SNP.CHR - SNP location in GRCh37.p13 (chromosome)
- SNP.POSITION - SNP location in GRCh37.p13 (position)
- ENSEMBL - ENSEMBL gene ID
- HGNC - HGNC gene symbol
- GENE.CHR - Gene position in GRCh37.p13 (chromosome)
- BETA - eQTL coefficient (calculated using R lm() function)
- T.STAT - Value of the t statistic
- PVALUE - eQTL nominal p-value
- P.ADJ - eQTL p-value corrected for multiple testing using Benjamini-Hochberg method
- CIS.TRANS - Whether the eQTL has been found in cis or in trans.
- QIK - SNP modularity
CHROMSTATE - Chromatin state at the SNP location. Obtained using the epigenomic roadmap core 15-state model data from the corresponding tissue 1.
CHROMSTATE
| Tissue | Epigenomic Roadmap Tissue ID |
|---|---|
| Adipose subcutaneous | E063 |
| Artery aorta | E065 |
| Fibroblast cell line | E126 |
| Esophagus mucosa | E079 |
| Heart left ventricle | E095 |
| Lung | E096 |
| Skeletal muscle | E107 |
| Whole blood | E062 |
Gene Ontology
- COMMUNITY - Community ID
- GOID - Gene Ontology ID
- TERM - Gene Ontology Term
- ONTOLOGY - Ontology (BP = biological process, CC = cellular content, MF = molecular function)
- PVALUE - Enrichment nominal p-value obtained using the Bioconductor R GOstats package [2].
- P.ADJ - Enrichment p-value corrected for multiple testing using Benjamini-Hochberg method
- ODDS.RATIO - Enrichment odds ratios
- EXPECTED - Number of expected genes for the GO term
- OBSERVED - Number of observed genes for the GO term
- SIZE - Total number of genes for the GO term
Genes
- ENSEMBL - ENSEMBL gene ID
- HGNC - HGNC gene symbol
- COMMUNITY - Gene community in eQTL network
- GENE.CHR - Gene position in GRCh37.p13 (chromosome)
- GENE.START - Gene position in GRCh37.p13 (gene start)
- GENE.END - Gene position in GRCh37.p13 (gene end)
SNPs
- RSID - SNP ID in dbSNP 142
- COMMUNITY - SNP community in eQTL network
- SNP.CHR - SNP location in GRCh37.p13 (chromosome)
- SNP.POSITION - SNP location in GRCh37.p13 (position)
Bibliography
[1] Roadmap Epigenomics Consortium (2015). Integrative analysis of 111 reference human epigenomes. Nature 518, 317-330.
[2] Maud Fagny, Joseph N. Paulson, Marieke L. Kuijjer, Abhijeet R. Sonawane, Cho-Yi Chen, Camila M. Lopes-Ramos, Kimberly Glass, John Quackenbush, and John Platig (2017). Exploring regulation in tissues with eQTL networks. PNAS published ahead of print August 29, 2017, doi:10.1073/pnas.1707375114
Nongenic cancer-risk SNPss affect oncogenes, tumor suppressor genes, and immune function
Genome-wide associations studies (GWASes) have identified many non-coding germline single nucleotide polymorphisms (SNPs) that are associated with an increased risk of developing cancer. However, how these SNPs impact cancer risk is still largely unknown. We used a systems biology approach to analyze the regulatory role of cancer-risk SNPs in thirteen tissues. Using data from the Genotype-Tissue Expression (GTEx) project, we performed an expression quantitative trait locus (eQTL) analysis. We represented both significant cis- and trans-eQTLs as edges in tissue-specific eQTL bipartite networks. Each network is organized into communities that group sets of SNPs and functionally-related genes. When mapping cancer-risk SNPs to eQTL networks, we find that in each tissue, they are significantly overrepresented in communities enriched for immune response processes as well as tissue-specific functions. Moreover, cancer-risk SNPs are more likely to be "cores" of communities and influence the expression of many genes within the same biological processes. Finally, cancer-risk SNPs preferentially target oncogenes and tumor suppressor genes, suggesting they may alter the expression of key cancer-associated genes. This approach provides a new way of understanding genetic effects on cancer risk and provides a biological context for interpreting the results of GWAS cancer studies.
Please cite:
Maud Fagny, John Platig, Marieke L. Kuijjer, Xihong Lin and John Quackenbush (2019). Nongenic cancer-risk SNPs affect oncogenes, tumor suppressor genes, and immune function. bioRXiv, December 2018
QTL Associations for given Gene or SNP in community:
GO terms for the community
Cancer risk-SNPs Analysis Legend
QTL Associations
- RSID - Cancer riss SNP ID in dbSNP 142
- CANCERS - List of cancer types to which SNP RSID has been associated to in GWAS
- GENOMIC.LOCATION - Genomic location according to GWAS catalog (based on UCSC SNP annotations)
- LD.BLOCK - Linkage disequilibrium block ID of the RSID
- CORE.SCORE - Median core score (SNP modularity) for community
- ENSEMBL - ENSEMBL gene ID
- HGNC - HGNC gene symbol
- GENE.CHR - Gene position in GRCh37.p13 (chromosome)
- GENE.START - Gene start position in GRCh37.p13 (chromosome)
- GENE.END - Gene end position in GRCh37.p13 (chromosome)
- TOP.LD.BLOCK.RSID - ID of top SNP for eQTL association results for this LD block and this gene.
- SNP.COMMUNITY - Community of top SNP within LD block
- SNP.CHR - SNP location in GRCh37.p13 (chromosome)
- SNP.POS - SNP location in GRCh37.p13 (position)
- BETA - eQTL coefficient (calculated using R lm() function)
- T.STAT - Value of the t statistic
- PVALUE - eQTL nominal p-value
- BH.CORR.P - eQTL p-value corrected for multiple testing using Benjamini-Hochberg method
- CIS.OR.TRANS - Whether the eQTL has been found in cis or in trans.
Gene Ontology
- COMMUNITY - Community ID
- GOID - Gene Ontology ID
- TERM - Gene Ontology Term
- ONTOLOGY - Ontology (BP = biological process, CC = cellular content, MF = molecular function)
- PVALUE - Enrichment nominal p-value obtained using the Bioconductor R GOstats package [3].
- P.ADJ - Enrichment p-value corrected for multiple testing using Benjamini-Hochberg method
- ODDS.RATIO - Enrichment odds ratios
- EXPECTED - Number of expected genes for the GO term
- OBSERVED - Number of observed genes for the GO term
- SIZE - Total number of genes for the GO term
Below we provide the cancer-risk SNP eQTL associations provided as an R rds file.*